
No One Can Predict the Future
Let's start with an uncomfortable truth: no retirement planning tool, no financial advisor, and no amount of sophisticated modeling can tell you exactly what will happen over the next 20, 30, or 40 years. Markets will surprise us. Inflation will fluctuate. Tax laws will change. Your own life will take turns you did not expect.
What a good planning tool can do is help you explore the range of likely outcomes based on reasonable assumptions, and then help you understand which assumptions matter most so you can focus your attention where it counts.
RetirePlanAI is transparent about every assumption it uses. All defaults are based on historical data. All of them are adjustable. And the tool gives you ways to test how sensitive your plan is to changes in each one.
RetirePlanAI's Default Assumptions
When you create a plan, RetirePlanAI starts with the following default values. Each is grounded in historical data, not optimism.
General Inflation: 3.27%
This is the average annual increase in consumer prices based on CPI data from 1913 to 2024, covering more than a century of U.S. economic history. It includes periods of very low inflation (the 2010s), moderate inflation (most decades), and high inflation (the 1970s and early 1980s, and the 2021-2023 spike).
Inflation is applied to your expenses each year in the projection. If you spend $6,000 per month today, at 3.27% inflation that becomes roughly $6,200 next year, $10,000 in 15 years, and over $16,000 in 30 years. This compounding effect is why inflation is sometimes called the "silent killer" of retirement plans.
Housing Appreciation: 5.13%
Based on U.S. housing price data from 2001 to 2025. This rate applies to real estate you own, affecting the projected value of your home over time. It matters most if you plan to sell your home or downsize during retirement.
Note that housing appreciation varies enormously by location. Coastal cities have historically appreciated faster than rural areas. If you have strong reason to believe your local market will behave differently from the national average, adjust this number.
Medical Inflation: 5.14%
Healthcare costs have consistently risen faster than general inflation. This rate is based on the medical care component of CPI from 1935 to 2025. This rate is stored in your plan settings for reference, though currently all budget expenses use the general inflation rate in projections.
This is one of the most important assumptions for retirees. A couple retiring at 65 can expect to spend several hundred thousand dollars on healthcare over their remaining lifetime, and that number grows significantly with higher medical inflation assumptions.
Social Security COLA: 3.8%
Social Security benefits are adjusted annually based on changes in the Consumer Price Index for Urban Wage Earners and Clerical Workers (CPI-W). The average annual adjustment from 1975 to 2023 has been 3.8%. In practice, this has ranged from 0% (2010, 2011, 2016) to 14.3% (1980), with more typical recent adjustments between 1% and 9%.
This rate determines how your Social Security income grows over time in the projection. If you toggle COLA on for your Social Security income stream (which is the default), this rate is applied each year.
Stable Account Growth Rates
Accounts marked as stable (cash, certificates of deposit, money market funds, stable value funds) use the rates of return you configure for each account. If no rate is configured, a fallback of 2.0% is used. These accounts prioritize capital preservation over growth, and their returns rarely outpace inflation significantly.
Investment Return Assumptions
Your investment return assumptions have an outsized impact on your projections. RetirePlanAI gives you several ways to configure them.
Age-Based Return Rates
RetirePlanAI lets you set different return rates for different age ranges on a per-account basis. This lets you model a gradual shift from aggressive to conservative as you age, including different assumptions before and after retirement. For example:
- Ages 55-60: 7% (growth-oriented allocation)
- Ages 61-70: 6% (balanced allocation)
- Ages 71-80: 5% (moderately conservative)
- Ages 81+: 4% (conservative, capital preservation)
This approach mirrors what many advisors call a "glide path," gradually reducing risk as you age and have less time to recover from market downturns.
How Monte Carlo Uses Your Return Assumptions
When you run a Monte Carlo simulation, your expected return is not applied as a fixed number each year. Instead, it serves as the center point of a probability distribution. The simulation generates thousands of possible market scenarios where annual returns vary randomly around your expected return, based on historical volatility patterns.
In some simulated years, your portfolio earns 15% or more. In others, it loses 20%. The Monte Carlo engine tests whether your plan survives across the full range of these possibilities, which is far more useful than assuming smooth, constant returns that never actually happen in real markets.
Life Expectancy: How Long Should You Plan For?
RetirePlanAI projects through age 95. This is deliberately conservative, and that is the point.
The average American life expectancy at birth is approximately 78 years. But this number is misleading for retirement planning because it includes people who die young from accidents, illness, and other causes. If you have already reached age 65, your statistical life expectancy is about 85. If you are reasonably healthy at 65, you have a meaningful chance of living into your 90s.
Here is why planning to 95 makes sense:
- Running out of money is worse than leaving money behind. If you plan to 85 and live to 92, you face seven years with no portfolio to draw from. If you plan to 95 and pass away at 85, your heirs inherit the surplus. The downside risk is asymmetric.
- Advances in medicine continue to extend lifespans. Someone who is 55 today may benefit from medical advances that are not yet available.
- Couples should plan for the longer-lived spouse. If there is a 50% chance that at least one member of a 65-year-old couple will live past 90, planning to 95 is not overly cautious.
You can adjust life expectancy in Plan Settings. If you have specific health considerations, it is reasonable to use a different number. Just be thoughtful about the consequences of underestimating.
Why Small Assumption Changes Matter So Much
Retirement projections compound over decades. Small percentage differences, seemingly trivial in a single year, accumulate into enormous differences over a 30-year retirement. Here are some concrete examples.
Inflation: 3% vs. 4%
If you spend $50,000 per year today:
- At 3% inflation over 30 years, your spending grows to about $121,000 per year
- At 4% inflation over 30 years, your spending grows to about $162,000 per year
That is a $41,000 per year difference from just one percentage point of inflation. Over a 30-year retirement, the cumulative difference in total spending is over $500,000.
Investment Returns: 6% vs. 7%
For a $1 million portfolio:
- At 6% annual return, the portfolio grows to about $1.06 million after one year
- At 7% annual return, the portfolio grows to about $1.07 million after one year
A $10,000 difference does not sound dramatic. But compounded over 20 years without withdrawals, 6% grows $1 million to $3.2 million while 7% grows it to $3.9 million, a difference of $700,000. And this is before accounting for the interaction between returns and withdrawals, where the compounding effect is even more pronounced.
Retirement Age: 62 vs. 67
Retiring five years earlier creates a double impact:
- Five more years of withdrawals: Your portfolio must fund five additional years of living expenses
- Five fewer years of contributions: You miss five years of saving, employer matches, and investment growth
- Potentially lower Social Security: Claiming at 62 instead of 67 can reduce your benefit by 30%
For someone contributing $20,000 per year with a $500,000 portfolio and $50,000 in annual spending, the difference between retiring at 62 and 67 can swing their Monte Carlo success rate from under 60% to over 90%. Retirement age is often the single most impactful lever in the entire plan.
The Sensitivity Analysis Tool
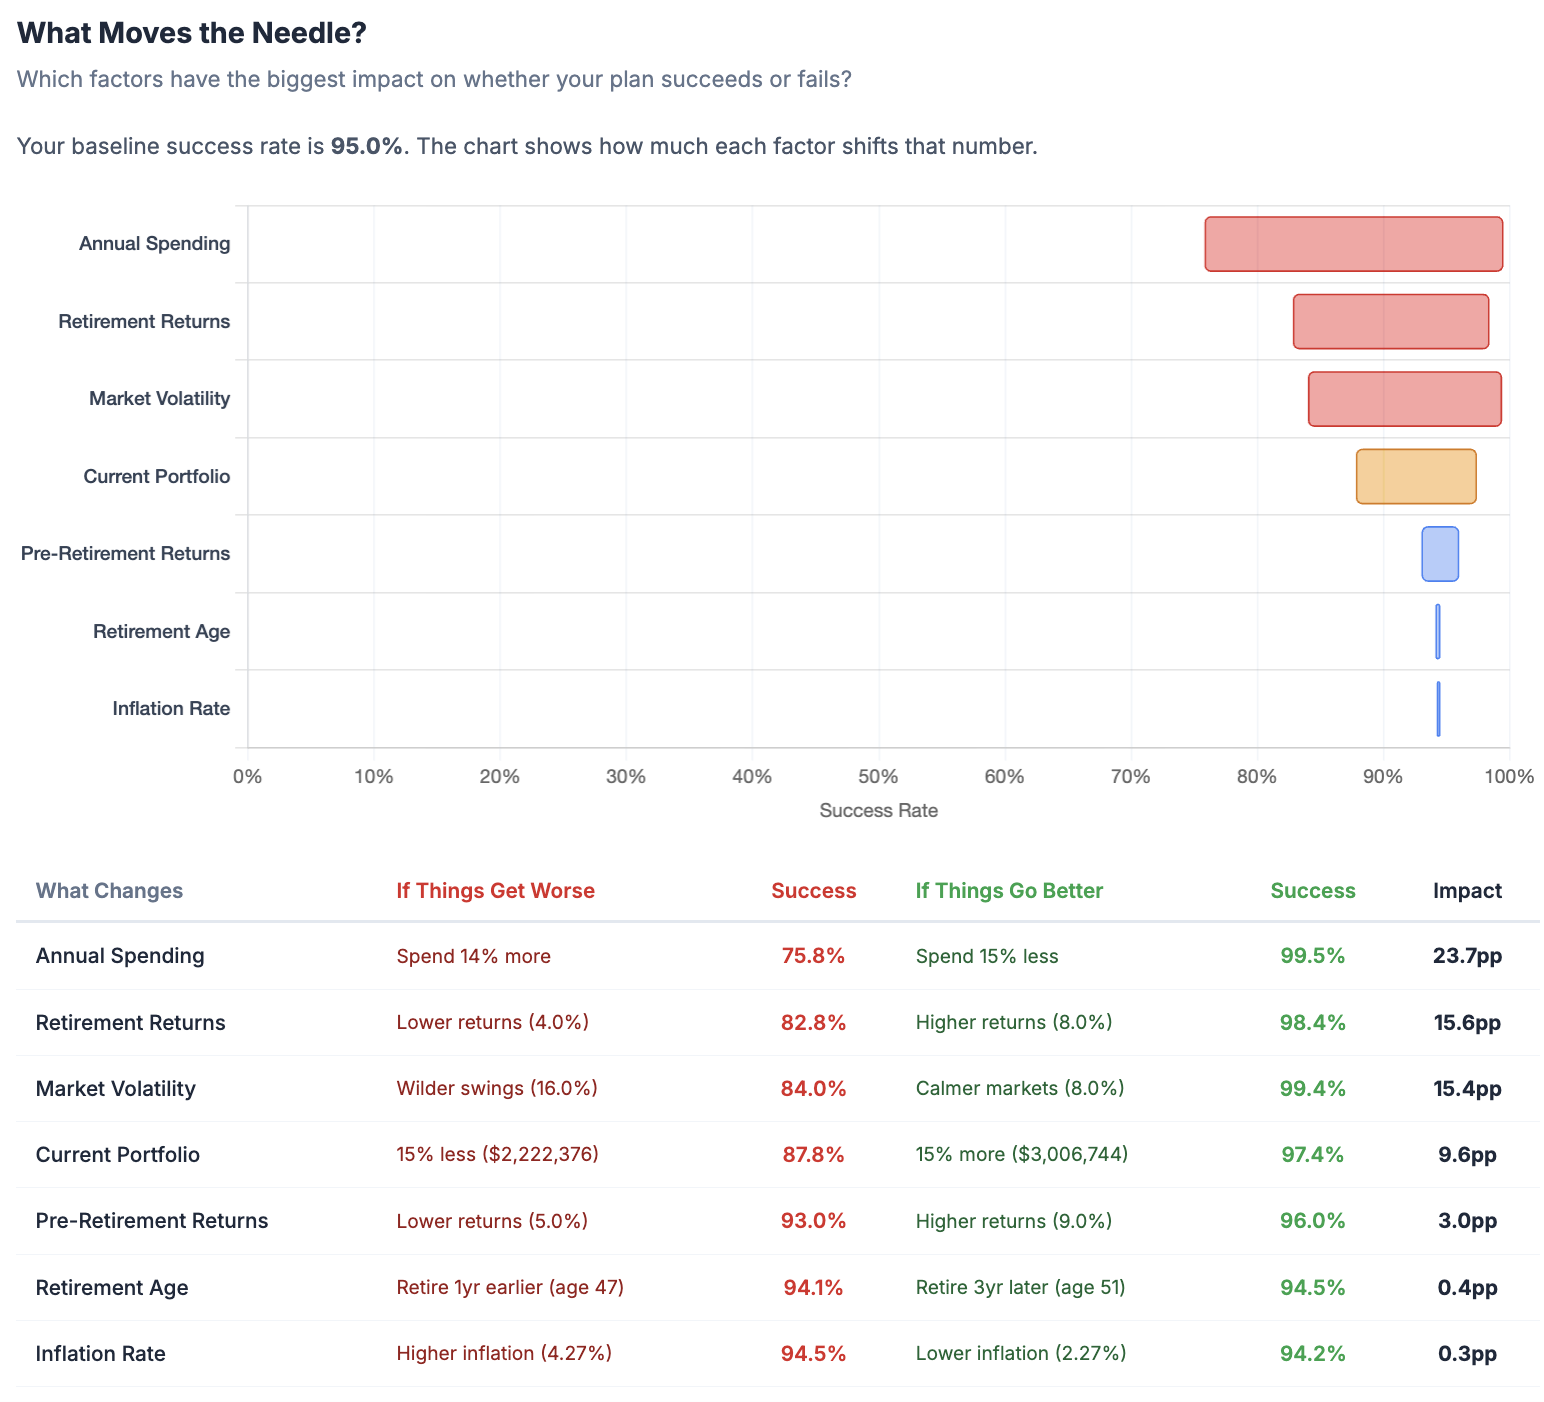
RetirePlanAI includes a Sensitivity Analysis tool that systematically tests which assumptions have the biggest impact on your specific plan. It works by varying each assumption up and down from your current settings and measuring the change in your Monte Carlo success rate.
The results are displayed as a tornado chart, ranking variables from most impactful to least. For many people, the chart reveals that retirement age and spending level dominate everything else, while the difference between 3% and 4% inflation, for example, matters less than they expected.
This tool is valuable because it helps you focus your energy. If your success rate is highly sensitive to investment returns but barely affected by inflation, you know that your asset allocation decisions deserve more attention than fine-tuning your inflation assumption by a fraction of a percent.
How to Use Assumptions Wisely
Do Not Just Accept the Defaults
The defaults are reasonable starting points based on historical averages. But your situation is not average. Think about your specific circumstances:
- Do you live in a high-cost area where housing appreciation has historically outpaced the national average?
- Do you have a family history of longevity (or health conditions that might affect life expectancy)?
- Is your portfolio heavily tilted toward growth stocks (higher expected return, higher volatility) or bonds (lower expected return, lower volatility)?
- Are you planning a major spending change in retirement (downsizing, relocating, traveling extensively)?
Run Multiple Scenarios
The best way to deal with uncertainty is not to pick one "right" assumption. It is to test a range of assumptions and see how your plan holds up across them. RetirePlanAI's scenario comparison feature lets you create side-by-side plans with different assumptions.
A useful exercise: create three scenarios.
- Optimistic: Higher returns, lower inflation, earlier retirement
- Base case: Your best-guess assumptions
- Conservative: Lower returns, higher inflation, later retirement
If your plan succeeds in the conservative scenario, you can retire with confidence. If it only works in the optimistic scenario, you have more work to do.
Be More Conservative Where You Have Less Control
You cannot control market returns or inflation. You have much more control over how much you spend and when you retire. As a general principle:
- Investment returns: Use moderate to conservative estimates. If your portfolio has historically returned 8%, planning for 6-7% gives you a margin of safety.
- Inflation: Use the default or slightly higher. Underestimating inflation is one of the most common and most damaging planning mistakes.
- Spending: Be precise here. This is where accuracy helps most because it is a variable you directly control.
- Retirement age: Be honest with yourself. If you are planning to work until 67 but suspect you might burn out at 62, model both scenarios.
Revisit Assumptions Annually
Assumptions should not be set-and-forget. Review them at least once a year, and after any significant market event or life change. If inflation has been running at 5% for several years, it may be prudent to raise your inflation assumption. If your portfolio allocation has shifted, update your return expectations accordingly.
Where to Edit Your Assumptions
All assumptions in RetirePlanAI are editable in Plan Settings under the Market Assumptions section. Changes take effect the next time you run a projection or Monte Carlo simulation. You can also override certain assumptions at the account level (like growth rates for specific accounts) or at the income stream level (like COLA for individual income sources).
Remember: the goal is not to get assumptions "perfect." The goal is to use reasonable assumptions, understand their impact, and build a plan that works across a range of plausible futures. A plan that only succeeds under one narrow set of assumptions is not a plan. It is a hope.